Infographics & Data Visualization
CREATIVE DIRECTION/DATA VISUALIZATIONPROJECT DETAILS
ORGANIZATION: NCR Atleos | ALLPOINT NETWORK
PROJECT: Infographics & Data Visualization
ROLE: Creative Direction / Data Visualization
Overview
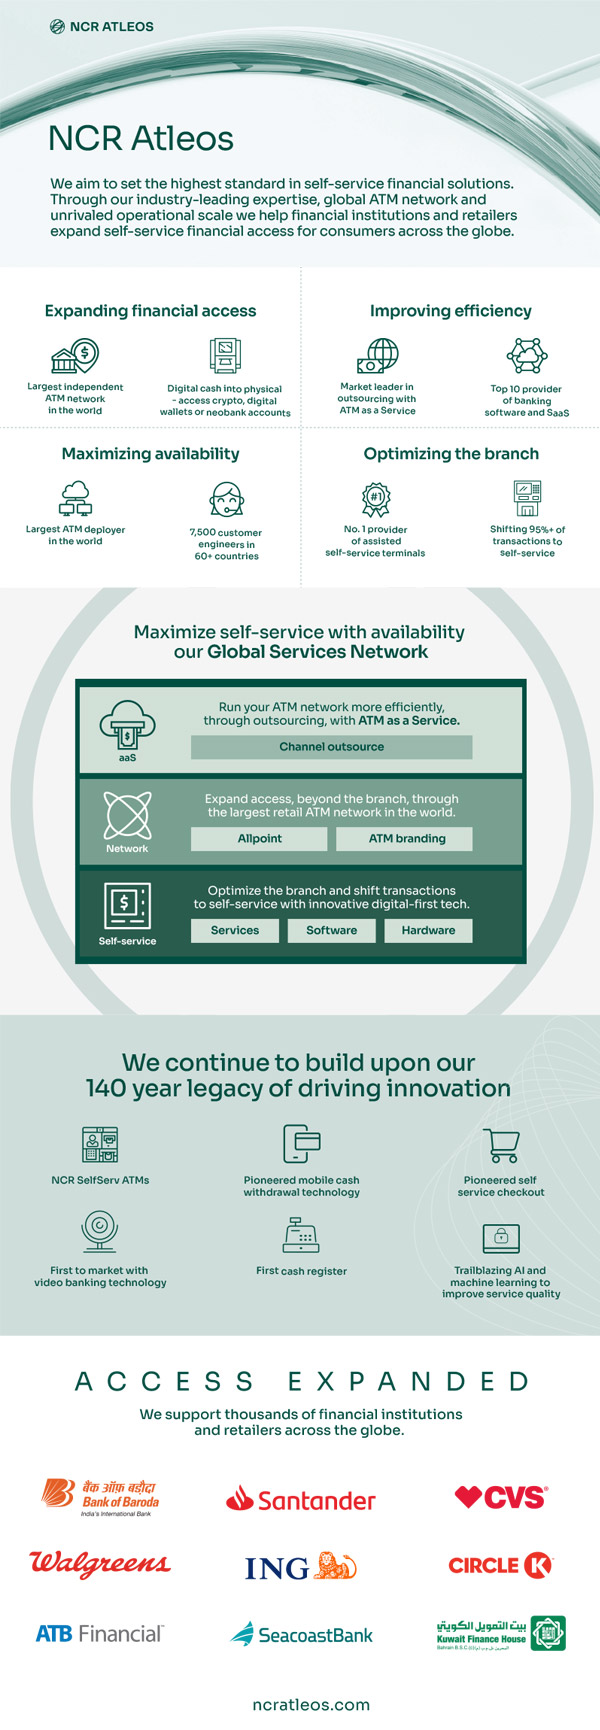
Technical content has a gravity problem. Left alone it pulls toward density, toward walls of text and tables of numbers that only the people who already understand the subject will read. Infographics exist to fight that gravity.
The work here spans a decade of financial technology content, product explainers, research findings, industry data, and operational information, translated into visual formats that people without a PhD in payments could actually engage with.
The challenge
ATM infrastructure, payment networks, and financial access are not simple subjects. The data is real and the stakes are real, but the audience is wide. Investors, partners, consumers, policymakers, and industry press all need to understand the same information and none of them want to read a white paper to get there.
The challenge was to find the entry point for each piece of content, the one idea that everything else organizes around, and build a visual argument from there. Not decoration applied to data. Data restructured into something that communicates on its own.
The work
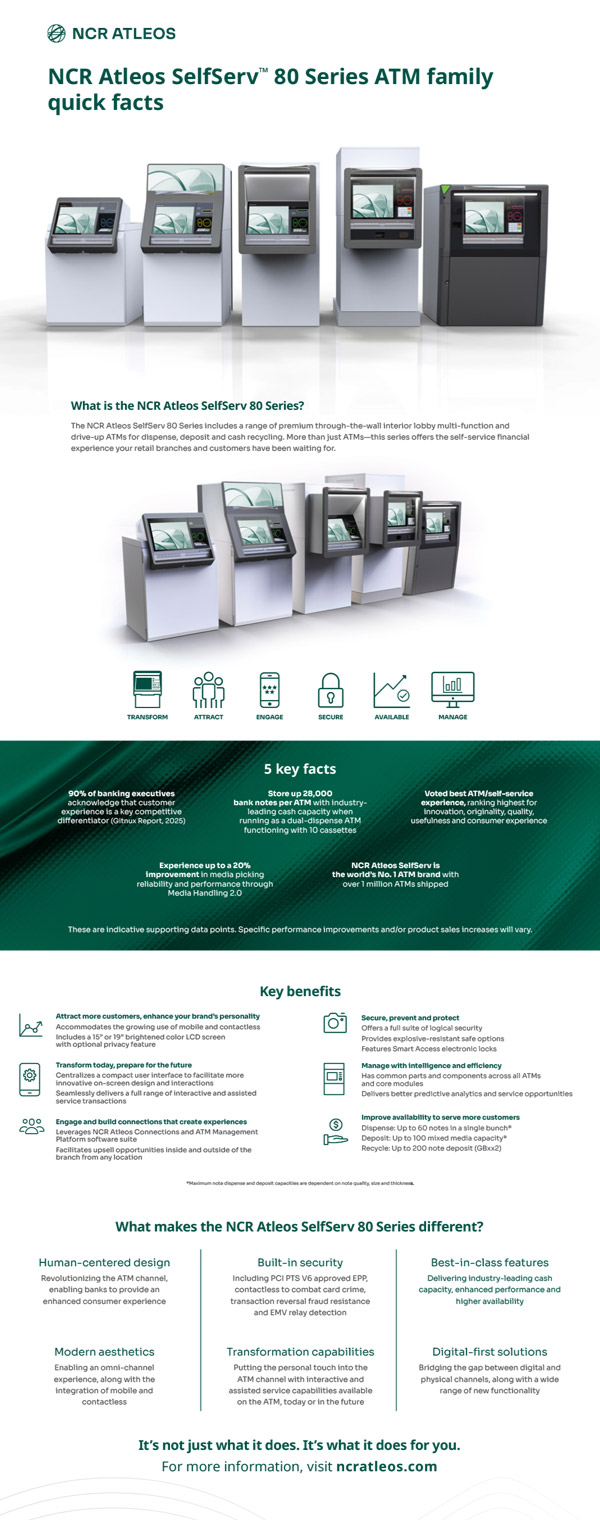
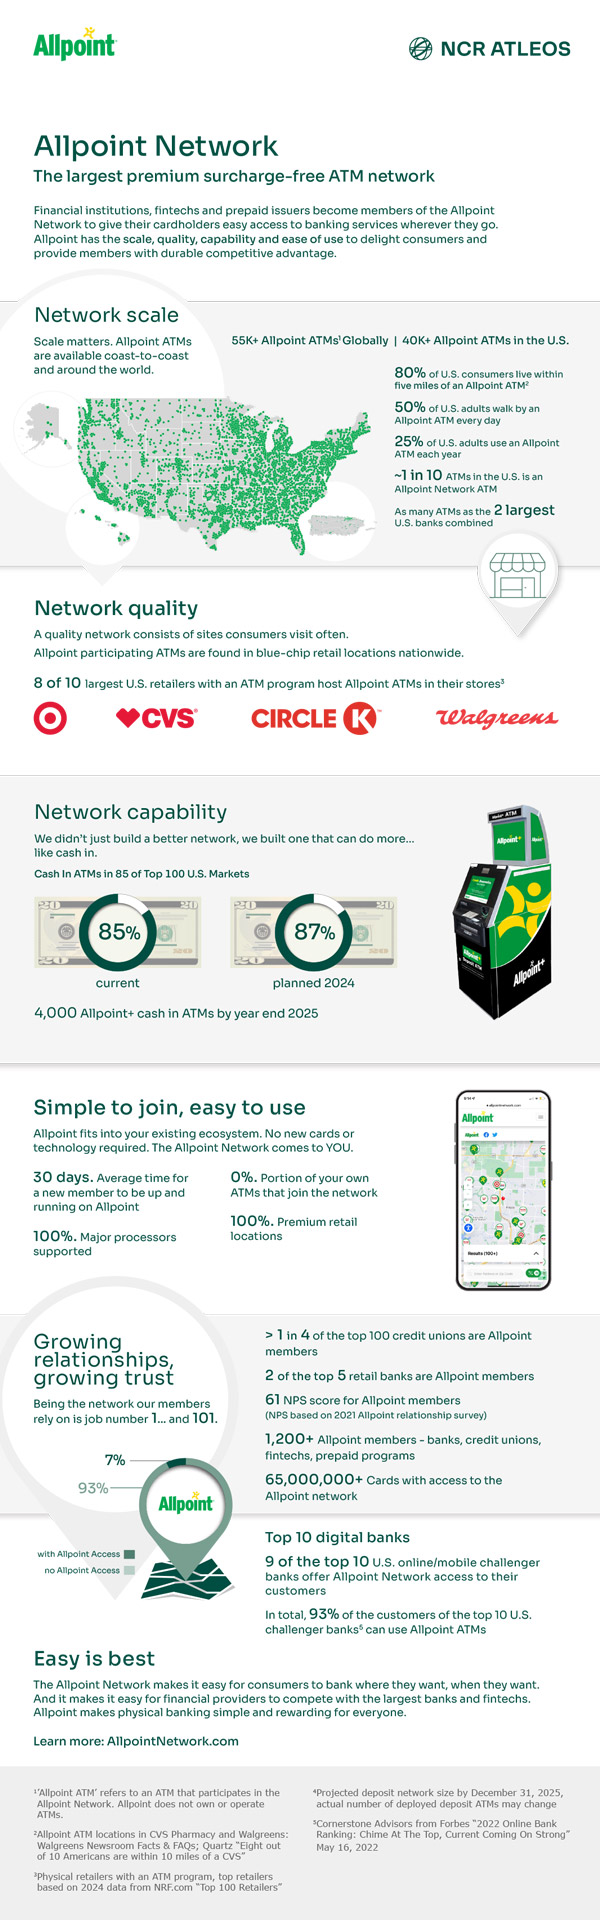
These infographics were produced across brand campaigns, research reports, product launches, and industry education initiatives. Some lived on the web. Some ran in presentations and sales materials. Some supported earned media and content marketing. Some won awards.
The discipline across all of them was the same: find the hierarchy in the data, reduce without losing accuracy, and build a visual system that makes the complexity feel inevitable rather than overwhelming.
Why it matters
The best infographic makes a reader feel like they already knew the information, they just needed someone to organize it for them. That clarity is not accidental. It is the result of the same editorial instincts that govern long-form writing applied to a format where every word and every pixel has to earn its place.